logo
Product categories

EbookNice.com

Most ebook files are in PDF format, so you can easily read them using various software such as Foxit Reader or directly on the Google Chrome browser.
Some ebook files are released by publishers in other formats such as .awz, .mobi, .epub, .fb2, etc. You may need to install specific software to read these formats on mobile/PC, such as Calibre.

Please read the tutorial at this link.  https://ebooknice.com/page/post?id=faq


We offer FREE conversion to the popular formats you request; however, this may take some time. Therefore, right after payment, please email us, and we will try to provide the service as quickly as possible.


For some exceptional file formats or broken links (if any), please refrain from opening any disputes. Instead, email us first, and we will try to assist within a maximum of 6 hours.

EbookNice Team
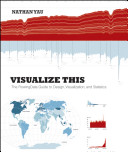
(Ebook) Visualize This: The FlowingData Guide to Design, Visualization, and Statistics by Yau, Nathan ISBN 9780470944882, 0470944889

  • SKU: EBN-33780856
Zoomable Image
$ 32 $ 40 (-20%)

Status:

Available

4.4

36 reviews
Instant download (eBook) Visualize This: The FlowingData Guide to Design, Visualization, and Statistics after payment.
Authors:Yau, Nathan
Pages:0 pages.
Year:2011
Editon:1
Publisher:Wiley
Language:english
File Size:86.0 MB
Format:pdf
ISBNS:9780470944882, 0470944889
Categories: Ebooks

Product desciption

(Ebook) Visualize This: The FlowingData Guide to Design, Visualization, and Statistics by Yau, Nathan ISBN 9780470944882, 0470944889

Practical data design tips from a data visualization expert of the modern age Data doesn't decrease; it is ever-increasing and can be overwhelming to organize in a way that makes sense to its intended audience. Wouldn't it be wonderful if we could actually visualize data in such a way that we could maximize its potential and tell a story in a clear, concise manner? Thanks to the creative genius of Nathan Yau, we can. With this full-color book, data visualization guru and author Nathan Yau uses step-by-step tutorials to show you how to visualize and tell stories with data. He explains how to gather, parse, and format data and then design high quality graphics that help you explore and present patterns, outliers, and relationships. Presents a unique approach to visualizing and telling stories with data, from a data visualization expert and the creator of flowingdata.com, Nathan Yau Offers step-by-step tutorials and practical design tips for creating statistical graphics, geographical maps, and information design to find meaning in the numbers Details tools that can be used to visualize data-native graphics for the Web, such as ActionScript, Flash libraries, PHP, and JavaScript and tools to design graphics for print, such as R and Illustrator Contains numerous examples and descriptions of patterns and outliers and explains how to show them Visualize This demonstrates how to explain data visually so that you can present your information in a way that is easy to understand and appealing.
*Free conversion of into popular formats such as PDF, DOCX, DOC, AZW, EPUB, and MOBI after payment.

Related Products