Most ebook files are in PDF format, so you can easily read them using various software such as Foxit Reader or directly on the Google Chrome browser.
Some ebook files are released by publishers in other formats such as .awz, .mobi, .epub, .fb2, etc. You may need to install specific software to read these formats on mobile/PC, such as Calibre.
Please read the tutorial at this link. https://ebooknice.com/page/post?id=faq
We offer FREE conversion to the popular formats you request; however, this may take some time. Therefore, right after payment, please email us, and we will try to provide the service as quickly as possible.
For some exceptional file formats or broken links (if any), please refrain from opening any disputes. Instead, email us first, and we will try to assist within a maximum of 6 hours.
EbookNice Team
Status:
Available5.0
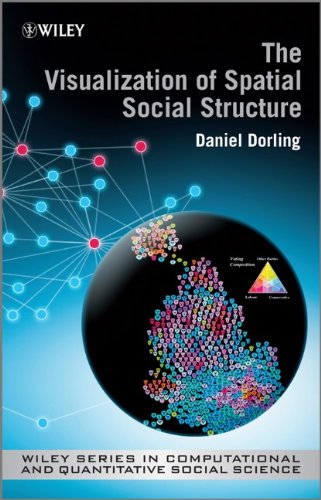
18 reviewsThe visualization of spatial social structure means, literally, making visible the geographical patterns to the way our lives have come to be socially organised, seeing the geography in society. To a statistical readership visualization implies using data. More widely defined it implies freeing our imaginations.
The Visualization of Spatial Social Structure introduces the reader to new ways of thinking about how to look at social statistics, particularly those about people in places. The author presents a unique combination of statistical focus and understanding of social structures and innovations in visualization, describing the rationale for, and development of, a new way of visualizing information in geographical research. These methods are illustrated through extensive full colour graphics; revealing mistakes, techniques and discoveries which present a picture of a changing political and social geography. More complex aspects on the surface of social landscapes are revealed with sculptured symbols allowing us to see the relationships between the wood and the trees of social structure. Today's software can be so flexible that these techniques can now be emulated without coding.
This book centres on a particular place and time; 1980s Britain, and a particular set of records; routine social statistics. A great deal of information about the 80s' social geography of Britain is contained within databases such as the population censuses, surveys and administrative data. Following the release of the 2011 census, now is a good time to look back at the past to introduce many new visualization techniques that could be used by future researchers.

4.5
12 reviews


4.7
39 reviews

4.8
8 reviews

4.8
17 reviews
4.6
16 reviews