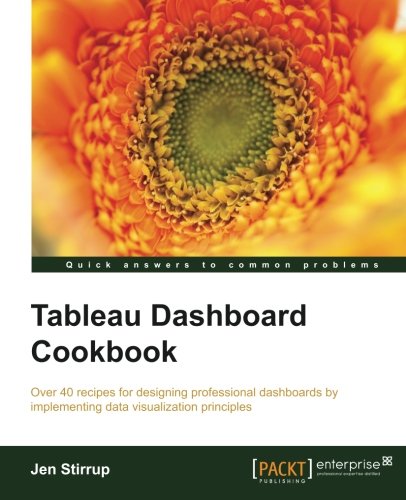
(Ebook) Tableau dashboard cookbook : over 40 recipes on designing professional dashboards by implementing data visualization principles by Jen Stirrup ISBN 9781782177906, 9781782177913, 1782177906, 1782177914
Key FeaturesUtilize the features of Tableau to create, design, and develop effective, beautiful dashboardsUse data visualization principles to help you to design dashboards that enlighten and support business decisionsExplore Tableau's functionality with practical lessons that help you to build your own solution as you progress through the bookBook DescriptionWith increasing interest and enthusiasm for data visualization in the media, businesses are looking to create effective dashboards that engage as well as communicate the truth of data. Tableau makes data accessible to everyone, and is a great way of sharing enterprise dashboards across the business. The deceptively simple Tableau interface hides a variety and complexity of features available for dashboarding, and this book will help you to become familiar with these features.Tableau offers an easy-to-use and fun way of designing, constructing, and sharing your dashboards. This book will familiarize you with its features and enable you to develop and enhance your dashboard skills, starting with an overview of what dashboard is followed by how you can collect data using various mathematical formulas. Next you'll learn to filter and group data, as well as how to use various functions to present the data in an appealing and accurate way. The book will also teach you how to use the key advanced string functions to play with data and images. You will be walked through the various features of Tableau including dual axes, scatterplot matrices, heat maps, and sizing. Finally, this book will help you consider what to do next with your dashboard, whether it's on a server or in collaboration with other tools.What you will learnCustomize your designs to meet the needs of your business using TableauUse Tableau to prototype, develop, and deploy the final dashboardCommunicate and share your dashboards internally within the business, or externally with the rest of the world via Tableau publicIntegrate your data to provide mashed-up dashboardsBe inspired with color, motion, and other design tricks when designing dashboardsFormulate your business rules into Tableau formulae that you can reuseConsider your business users and data consumer needs as you learn about color theory and psychology and put them into actionAbout the AuthorJen Stirrup is an award-winning and internationally recognized business intelligence and data visualization expert, author, data strategist, and technical community advocate. She has been honored repeatedly, along with receiving peer recognition, as a Microsoft Most Valuable Professional (MVP) in SQL Server. She is one of the top 100 most globally influential tweeters on big data topics. Jen has nearly 20 years of experience in delivering business intelligence and data visualization projects for companies of various sizes across the world.Table of ContentsA Short Dash to Dashboarding!Summarizing Your Data for DashboardsInteracting with Data for DashboardsUsing Dashboards to Get ResultsPutting the Dash into DashboardsMaking Dashboards RelevantVisual Best PracticesTell the World! Share Your Dashboards
*Free conversion of into popular formats such as PDF, DOCX, DOC, AZW, EPUB, and MOBI after payment.


