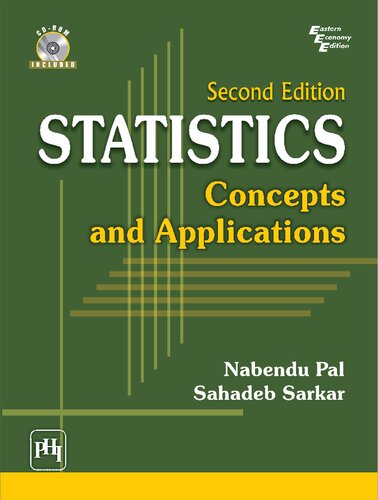

Most ebook files are in PDF format, so you can easily read them using various software such as Foxit Reader or directly on the Google Chrome browser.
Some ebook files are released by publishers in other formats such as .awz, .mobi, .epub, .fb2, etc. You may need to install specific software to read these formats on mobile/PC, such as Calibre.
Please read the tutorial at this link. https://ebooknice.com/page/post?id=faq
We offer FREE conversion to the popular formats you request; however, this may take some time. Therefore, right after payment, please email us, and we will try to provide the service as quickly as possible.
For some exceptional file formats or broken links (if any), please refrain from opening any disputes. Instead, email us first, and we will try to assist within a maximum of 6 hours.
EbookNice Team

Status:
Available4.7
39 reviews
ISBN 10: 8120334450
ISBN 13: 9788120334458
Author: Nabendu Pal
1 BASIC CONCEPTS OF STATISTICAL STUDIES
1.1 Population
1.2 Variable and Parameter
1.3 Sample
1.4 Basic Steps in a Statistical Study
1.5 Summary
1.6 Exercises
2 ORGANIZING A RAW DATASET
2.1 Organizing a Categorical Dataset
2.2 Organizing a Quantitative Dataset
2.3 About Outliers
2.4 Summary
2.5 Use of Technology
2.6 Exercises
3 PICTORIAL REPRESENTATION OF A DATASET
3.1 Bar Diagram or Bar Chart
3.2 Histogram
3.3 Pie Diagram
3.4 Stem-Leaf Display
3.5 Time Plot
3.6 Summary
3.7 Use of Technology
3.8 Exercises
4 SUMMARIZING A RAW DATASET
4.1 Central Tendency
4.2 Variability or Dispersion
4.3 Box-Whisker Plot (or Box Plot
4.4 Summary
4.5 Use of Technology
4.6 Exercises
5 SUMMARIZING AN ORGANIZED DATASET
5.1 Central Tendency
5.2 Variability
5.3 Summary
5.4 Use of Technology
5.5 Exercises
6 CONCEPTS OF PROBABILITY
6.1 Experiment and Sample Space
6.2 Events and Operations with Events
6.3 Probability of an Event
6.4 Basic Probability Rules
6.5 Applications of Probability Rules
6.6 Conditional Probability
6.7 Summary
6.8 Exercises
7 RANDOM VARIABLES
7.1 How Random Variables Arise
7.2 Probability Distribution of a Random Variable
7.3 Mean or Expected Value of a Random Variable
7.4 Probability Histogram of a Random Variable
7.5 Variance and Standard Deviation of a Random Variable
7.6 Summary
7.7 Exercises
8 BINOMIAL EXPERIMENTS
8.1 Structure of a Binomial Experiment
8.2 Binomial Probability Distribution
8.3 Use of Binomial Probability Table
8.4 Summary
8.5 Use of Technology
8.6 Exercises
9 NORMAL CURVE AND NORMAL DISTRIBUTION
9.1 Motivation Behind a Normal Curve
9.2 Properties of a Normal Curve
9.3 Normal Probability Distribution
9.4 Areas Under a Normal Curve
9.5 Summary
9.6 Use of Technology
9.7 Exercises
10 APPLICATIONS OF THE NORMAL DISTRIBUTION
10.1 Approximating a Binomial Probability
10.2 The Normal Theorem and the Central Limit Theorem
10.3 Summary
10.4 Use of Technology
10.5 Exercises
11 ESTIMATION OF POPULATION PARAMETERS
11.1 Parameter and Statistic
11.2 Point and Interval Estimation
11.3 Interval Estimation of Three Common Parameters
11.3.1 Interval Estimation of a Population Mean
11.3.2 Interval Estimation of a Population Standard Deviation
11.3.3 Interval Estimation of a Population Proportion
11.4 Summary
11.5 Use of Technology
11.6 Exercises
12 HYPOTHESIS TESTING FOR A SINGLE POPULATION
12.1 Concept of a Hypothesis
12.2 Tests Involving a Population Mean
12.3 Tests Involving a Population Proportion
12.4 Tests Involving a Population Standard Deviation
12.5 The Concept of P-value
12.6 Verifying Normality For A Given Dataset
12.7 Summary
12.8 Use of Technology
12.9 Exercises
13 HYPOTHESIS TESTING TO COMPARE TWO POPULATIONS
13.1 Comparison of Two Populations
13.2 Tests for Two Population Means (Independent Samples
13.2.1 Population Standard Deviations are Unknown but Equal
13.2.2 Population Standard Deviations are Unknown and Unequal
13.3 Tests for Two Population Means (Dependent Samples
13.4 Tests for Two Population Proportions (Independent Samples
13.5 Tests for Two Population Variances (Independent Samples
13.6 The P-Value Approach
13.7 Summary
13.8 Use of Technology
13.9 Exercises
14 BIVARIATE QUANTITATIVE DATA: CORRELATION AND
REGRESSION
14.1 Concepts of a Bivariate Dataset
14.2 Correlation Coefficient
14.3 Inferences on a Population Correlation Coefficient
14.4 The Regression Line
14.5 Inferences on the Population Regression Line
14.6 Summary
14.7 Use of Technology
14.8 Exercises
15 BIVARIATE CATEGORICAL DATA: CONTINGENCY TABLES
15.1 Concepts of a Contingency Table
15.2 Testing Independence of Two Categorical Variables
15.3 Summary
15.4 Use of Technology
15.5 Exercises
16 MULTINOMIAL EXPERIMENTS: GOODNESS OF FIT TEST
16.1 Structure of a Multinomial Experiment
16.2 Multinomial Probability Distribution (MPD
16.3 Goodness of Fit Test of MPD for a Given Dataset
16.4 Summary
16.5 Use of Technology
16.6 Exercises
17 HYPOTHESIS TESTING TO COMPARE MULTIPLE POPULATIONS
17.1 Comparing Multiple Populations
17.2 Comparing Multiple Population Variances
17.3 Comparing Multiple Population Means
17.3.1 Data from Unrestricted (independent) Samples
(One-way ANOVA
17.3.2 Data from Block Restricted Samples
(Two-way ANOVA
17.4 Summary
17.5 Use of Technology
17.6 Exercises
18 QUALITY MANAGEMENT USING STATISTICS
18.1 Concept of Statistical Quality Control
18.2 Principles of Statistical Process Control
18.3 Control Charts and Hypothesis Testing
18.4 Control Charts for Quantitative Data
18.4.1 The X-chart
18.4.2 The R-chart
18.4.3 The s-chart
18.5 Control Chart for Categorical Data: p-chart
18.6 Summary
18.7 Use of Technology
18.8 Exercises
statistics concepts and applications
understanding statistics and experimental design
statistics and probability with applications ebook
statistics and probability with applications 4th edition pdf
statistics and probability with applications textbook pdf
Tags: Nabendu Pal, Statistics, Concept