logo
Product categories

EbookNice.com

Most ebook files are in PDF format, so you can easily read them using various software such as Foxit Reader or directly on the Google Chrome browser.
Some ebook files are released by publishers in other formats such as .awz, .mobi, .epub, .fb2, etc. You may need to install specific software to read these formats on mobile/PC, such as Calibre.

Please read the tutorial at this link.  https://ebooknice.com/page/post?id=faq


We offer FREE conversion to the popular formats you request; however, this may take some time. Therefore, right after payment, please email us, and we will try to provide the service as quickly as possible.


For some exceptional file formats or broken links (if any), please refrain from opening any disputes. Instead, email us first, and we will try to assist within a maximum of 6 hours.

EbookNice Team
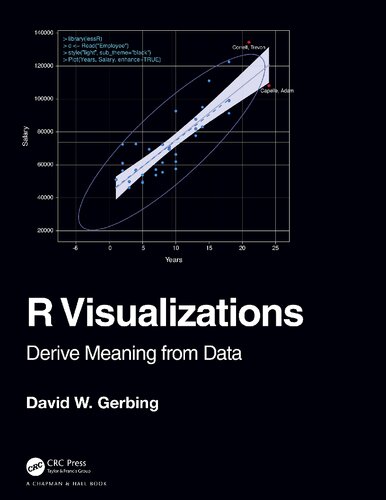
(Ebook) R Visualizations: Derive Meaning from Data by David Gerbing ISBN 9780429894923, 9780429470837, 9780429894916, 9781032243276, 0429894929

  • SKU: EBN-10993608
Zoomable Image
$ 32 $ 40 (-20%)

Status:

Available

5.0

25 reviews
Instant download (eBook) R Visualizations: Derive Meaning from Data after payment.
Authors:David Gerbing
Pages:247 pages.
Year:2020
Editon:1
Publisher:CRC Press
Language:english
File Size:15.53 MB
Format:pdf
ISBNS:9780429894923, 9780429470837, 9780429894916, 9781032243276, 0429894929
Categories: Ebooks

Product desciption

(Ebook) R Visualizations: Derive Meaning from Data by David Gerbing ISBN 9780429894923, 9780429470837, 9780429894916, 9781032243276, 0429894929

R Visualizations: Derive Meaning from Data focuses on one of the two major topics of data analytics: data visualization, a.k.a., computer graphics. In the book, major R systems for visualization are discussed, organized by topic and not by system. Anyone doing data analysis will be shown how to use R to generate any of the basic visualizations with the R visualization systems. Further, this book introduces the author’s lessR system, which always can accomplish a visualization with less coding than the use of other systems, sometimes dramatically so, and also provides accompanying statistical analyses. Key Features Presents thorough coverage of the leading R visualization system, ggplot2. Gives specific guidance on using base R graphics to attain visualizations of the same quality as those provided by ggplot2. Shows how to create a wide range of data visualizations: distributions of categorical and continuous variables, many types of scatterplots including with a third variable, time series, and maps. Inclusion of the various approaches to R graphics organized by topic instead of by system. Presents the recent work on interactive visualization in R. David W. Gerbing received his PhD from Michigan State University in 1979 in quantitative analysis, and currently is a professor of quantitative analysis in the School of Business at Portland State University. He has published extensively in the social and behavioral sciences with a focus on quantitative methods. His lessR package has been in development since 2009.
*Free conversion of into popular formats such as PDF, DOCX, DOC, AZW, EPUB, and MOBI after payment.

Related Products