logo
Product categories

EbookNice.com

Most ebook files are in PDF format, so you can easily read them using various software such as Foxit Reader or directly on the Google Chrome browser.
Some ebook files are released by publishers in other formats such as .awz, .mobi, .epub, .fb2, etc. You may need to install specific software to read these formats on mobile/PC, such as Calibre.

Please read the tutorial at this link.  https://ebooknice.com/page/post?id=faq


We offer FREE conversion to the popular formats you request; however, this may take some time. Therefore, right after payment, please email us, and we will try to provide the service as quickly as possible.


For some exceptional file formats or broken links (if any), please refrain from opening any disputes. Instead, email us first, and we will try to assist within a maximum of 6 hours.

EbookNice Team
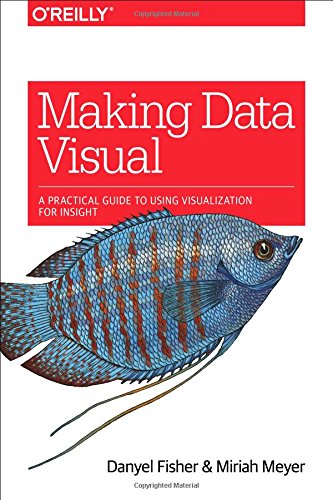
(Ebook) Making Data Visual: A Practical Guide to Using Visualization for Insight by Danyel Fisher, Miriah Meyer ISBN 9781491928462, 1491928468

  • SKU: EBN-6828320
Zoomable Image
$ 32 $ 40 (-20%)

Status:

Available

5.0

22 reviews
Instant download (eBook) Making Data Visual: A Practical Guide to Using Visualization for Insight after payment.
Authors:Danyel Fisher, Miriah Meyer
Pages:168 pages.
Year:2018
Editon:1
Publisher:O’Reilly Media
Language:english
File Size:20.37 MB
Format:epub
ISBNS:9781491928462, 1491928468
Categories: Ebooks

Product desciption

(Ebook) Making Data Visual: A Practical Guide to Using Visualization for Insight by Danyel Fisher, Miriah Meyer ISBN 9781491928462, 1491928468

You have a mound of data front of you and a suite of computation tools at your disposal. Which parts of the data actually matter? Where is the insight hiding? If you’re a data scientist trying to navigate the murky space between data and insight, this practical book shows you how to make sense of your data through high-level questions, well-defined data analysis tasks, and visualizations to clarify understanding and gain insights along the way.When incorporated into the process early and often, iterative visualization can help you refine the questions you ask of your data. Authors Danyel Fisher and Miriah Meyer provide detailed case studies that demonstrate how this process can evolve in the real world.You’ll learn:• The data counseling process for moving from general to more precise questions about your data, and arriving at a working visualization• The role that visual representations play in data discovery• Common visualization types by the tasks they fulfill and the data they use• Visualization techniques that use multiple views and interaction to support analysis of large, complex data sets
*Free conversion of into popular formats such as PDF, DOCX, DOC, AZW, EPUB, and MOBI after payment.

Related Products