logo
Product categories

EbookNice.com

Most ebook files are in PDF format, so you can easily read them using various software such as Foxit Reader or directly on the Google Chrome browser.
Some ebook files are released by publishers in other formats such as .awz, .mobi, .epub, .fb2, etc. You may need to install specific software to read these formats on mobile/PC, such as Calibre.

Please read the tutorial at this link.  https://ebooknice.com/page/post?id=faq


We offer FREE conversion to the popular formats you request; however, this may take some time. Therefore, right after payment, please email us, and we will try to provide the service as quickly as possible.


For some exceptional file formats or broken links (if any), please refrain from opening any disputes. Instead, email us first, and we will try to assist within a maximum of 6 hours.

EbookNice Team
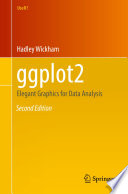
(Ebook) ggplot2: Elegant Graphics For Data Analysis (Second Edition) by Hadley Wickham, Carson Sievert ISBN 9783319242750, 331924275X

  • SKU: EBN-27446408
Zoomable Image
$ 32 $ 40 (-20%)

Status:

Available

5.0

32 reviews
Instant download (eBook) ggplot2: Elegant Graphics For Data Analysis (Second Edition) after payment.
Authors:Hadley Wickham, Carson Sievert
Pages:260 pages.
Year:2016
Editon:2nd Edition
Publisher:Springer-Verlag New York
Language:english
File Size:8.79 MB
Format:pdf
ISBNS:9783319242750, 331924275X
Categories: Ebooks

Product desciption

(Ebook) ggplot2: Elegant Graphics For Data Analysis (Second Edition) by Hadley Wickham, Carson Sievert ISBN 9783319242750, 331924275X

This new edition to the classic book by ggplot2 creator Hadley Wickham highlights compatibility with knitr and RStudio. ggplot2 is a data visualization package for R that helps users create data graphics, including those that are multi-layered, with ease. With ggplot2, it's easy to:produce handsome, publication-quality plots with automatic legends created from the plot specificationsuperimpose multiple layers (points, lines, maps, tiles, box plots) from different data sources with automatically adjusted common scalesadd customizable smoothers that use powerful modeling capabilities of R, such as loess, linear models, generalized additive models, and robust regressionsave any ggplot2 plot (or part thereof) for later modification or reusecreate custom themes that capture in-house or journal style requirements and that can easily be applied to multiple plotsapproach a graph from a visual perspective, thinking about how each component of the data is represented on the final plotThis book will be useful to everyone who has struggled with displaying data in an informative and attractive way. Some basic knowledge of R is necessary (e.g., importing data into R). ggplot2 is a mini-language specifically tailored for producing graphics, and you'll learn everything you need in the book. After reading this book you'll be able to produce graphics customized precisely for your problems, and you'll find it easy to get graphics out of your head and on to the screen or page.
*Free conversion of into popular formats such as PDF, DOCX, DOC, AZW, EPUB, and MOBI after payment.

Related Products