Most ebook files are in PDF format, so you can easily read them using various software such as Foxit Reader or directly on the Google Chrome browser.
Some ebook files are released by publishers in other formats such as .awz, .mobi, .epub, .fb2, etc. You may need to install specific software to read these formats on mobile/PC, such as Calibre.
Please read the tutorial at this link. https://ebooknice.com/page/post?id=faq
We offer FREE conversion to the popular formats you request; however, this may take some time. Therefore, right after payment, please email us, and we will try to provide the service as quickly as possible.
For some exceptional file formats or broken links (if any), please refrain from opening any disputes. Instead, email us first, and we will try to assist within a maximum of 6 hours.
EbookNice Team
Status:
Available0.0
0 reviewsISBN 10: 0947816690
ISBN 13: 9780947816698
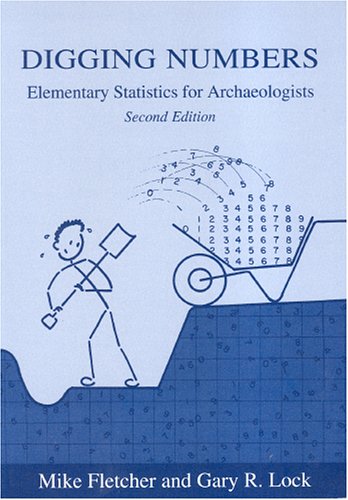
Author: Gary Lock
This fully revised second edition retains the hands-on simple approach of the first edition but with some significant modifications. Still covered in detail are descriptive and inferential techniques with each one worked through by hand on a common data-set, but new is a chapter covering an introduction to multivariate techniques. A new section provides SPSS PC programs designed with the beginner in mind. This book provides a practical manual to enable any archaeologist to start using statistics, as well as some more thoughtful considerations of the strengths and weaknesses of statistical methods and the results produced.
Section 1: Techniques for describing and presenting archaeological data
1. An introduction to data.
1.1 The example data set
1.2 Levels of measurement
1.3 Coding
1.4 Transforming variables
2. A statistical approach - signposting the way
3. Tabular and pictorial display
3.1 Basic aims and rules
3.2 Tabulating measurements
3.3 Tabulating frequencies
3.3.1 One variable
3.3.2 Two variables
3.4 Pictorial displays for nominal and ordinal data
3.4.1 The bar chart
3.4.2 The pie chart
3.5 Pictorial displays for continuous data
3.5.1 The histogram
3.5.2 The stem-and-leaf plot
- an alternative histogram?
3.5.3 The ogive
- the total so far
3.5.4 The scatterplot
- displaying two variables
4. Measures of position - the average
4.1 Introduction
4.2 The mode
4.3 The median
4.4 The mean
4.5 Comparing the mode, median and mean
5. Measures of variability the spread
5.1 Introduction
5.2 The range
5.3 The quartiles
5.4 The mean deviation.
5.5 The standard deviation
5.6 The coefficient of variation
5.7 Standardisation
5.8 Boxplots
Section 2: Techniques for drawing inferences from archaeological data
6. An introduction to probability and inference-drawing conclusions
6.1 Introduction
6.2 Probability
measuring chance and risk
6.2.1 The concept of probability
6.2.2 The concept of independence are two events related?
6.3 Probability distributions predicting results
6.4 The logic of hypothesis testing is it significant?
7. Sampling theory and sampling design
7.1 Introduction
7.2 Sampling strategies which measurements to take
7.3 A statistical background to sampling
7.3.1 The central-limit theorem -the law of averages
7.3.2 Confidence limits the reliability of results
7.4 Conclusions
8. Tests of difference
8.1 Introduction
8.2 One sample tests
comparing an observed measurement with an expected measurement
8.2.1 Test for sample mean
8.2.2 Test for median
8.2.3 Test for proportions
8.3 Two sample tests
comparing two observed measurements
8.3.1 Test for variation
8.3.2 Difference in means for paired data -assuming a normal distribution
8.3.3 Difference in means for paired data no assumption of normality
8.3.4 Difference in means for two independent samples - assuming a normal distribution
8.3.5 Difference in means for two independent samples no assumption of normality
8.3.6 Difference of two proportions
9. Tests of distribution
9.1 Introduction
9.2 Tests for randomness
9.3 Tests for normality
9.4 Tests between two distributions
10. Measures of association for continuous or ordinal data - are two variables related?
10.1 Introduction
10.2 Product-moment correlation coefficient
10.2.1 Testing the significance of the product-moment correlation coefficient
10.3 Spearman's rank correlation coefficient
10.3.1 Testing the significance of Spearman's rank correlation coefficient
10.4 Predicting using regression
11. Measures of association for categorical data are two characteristics related?
11.1 Introduction
11.2 The Chi-squared test
11.3 Guttman's lambda
11.4 Kendall's tau
12. An introduction to multivariate analysis
12.1 Reduction and grouping
12.1.1 Cluster Analysis
12.1.2 Correspondence Analysis
12.2 Prediction
12.2.1 Multiple Regression
12.2.2 Discriminant Analysis
Section 3: Books and software
13. A few recommended books
14. SPSS for Windows.
Appendix. Statistical tables
Table A. Random digits from a uniform distribution
Table B. Percentage points of the t-distribution
Table C. 5% points of the F distribution
Table D. Kolmogorov-Smirnov single sample test -(uniform and other completely specified distributions)
Table E. Kolmogorov-Smirnov single sample test (normal distribution)
Table F. Kolmogorov-Smimov two sample test
Table G. Critical values for correlation coefficient (pmcc)
Table H. Critical values for Spearman's rank correlation coefficient
Table I. Percentage points of the z distribution
Index
digging numbers: elementary statistics
digging numbers elementary statistics for archaeologists
digging numbers elementary statistics for archaeologists pdf
digging school
digging into math
Tags: Gary Lock, Digging Numbers, Elementary Statisticsfor Archaeologists
4.7
17 reviews
4.7
21 reviews


5.0
27 reviews