logo
Product categories

EbookNice.com

Most ebook files are in PDF format, so you can easily read them using various software such as Foxit Reader or directly on the Google Chrome browser.
Some ebook files are released by publishers in other formats such as .awz, .mobi, .epub, .fb2, etc. You may need to install specific software to read these formats on mobile/PC, such as Calibre.

Please read the tutorial at this link.  https://ebooknice.com/page/post?id=faq


We offer FREE conversion to the popular formats you request; however, this may take some time. Therefore, right after payment, please email us, and we will try to provide the service as quickly as possible.


For some exceptional file formats or broken links (if any), please refrain from opening any disputes. Instead, email us first, and we will try to assist within a maximum of 6 hours.

EbookNice Team
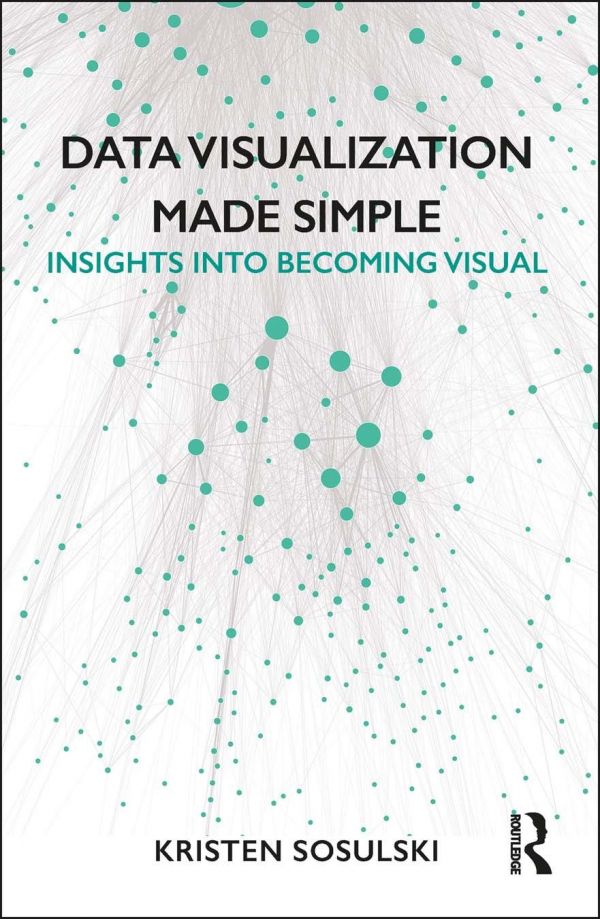
(Ebook) Data Visualization Made Simple: Insights Into Becoming Visual by Kristen Sosulski ISBN 9781138503915, 1138503916

  • SKU: EBN-7223198
Zoomable Image
$ 32 $ 40 (-20%)

Status:

Available

0.0

0 reviews
Instant download (eBook) Data Visualization Made Simple: Insights Into Becoming Visual after payment.
Authors:Kristen Sosulski
Pages:284 pages.
Year:2018
Editon:Paperback
Publisher:Routledge
Language:english
File Size:33.05 MB
Format:pdf
ISBNS:9781138503915, 1138503916
Categories: Ebooks

Product desciption

(Ebook) Data Visualization Made Simple: Insights Into Becoming Visual by Kristen Sosulski ISBN 9781138503915, 1138503916

Data Visualization Made Simple is a practical guide to the fundamentals, strategies, and real-world cases for data visualization, an essential skill required in today’s information-rich world. With foundations rooted in statistics, psychology, and computer science, data visualization offers practitioners in almost every field a coherent way to share findings from original research, big data, learning analytics, and more.
In nine appealing chapters, the book:
• examines the role of data graphics in decision-making, sharing information, sparking discussions, and inspiring future research;
• scrutinizes data graphics, deliberates on the messages they convey, and looks at options for design visualization; and
• includes cases and interviews to provide a contemporary view of how data graphics are used by professionals across industries
Both novices and seasoned designers in education, business, and other areas can use this book’s effective, linear process to develop data visualization literacy and promote exploratory, inquiry-based approaches to visualization problems.
*Free conversion of into popular formats such as PDF, DOCX, DOC, AZW, EPUB, and MOBI after payment.

Related Products